

Tennessee 72, ETSU 17: Advanced Box Score
Well that was easy, who's next? Oh, ok

Tennessee got everything you want in a FCS cupcake game on Saturday. It was “fast, fun, real” football as Josh Heupel likes to say—lots of points, lots of players getting snaps, no injuries. It will be a whole new world this Saturday as the Vols go from a game with no stakes to a game with all the stakes—but more on that as the week progresses. First, a look at some of the advanced stats from this past Saturday.
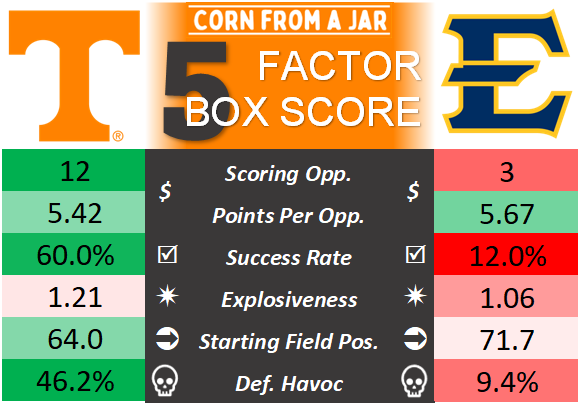
Five Factor Box Score
Some reminders of what you’re looking at here:
Scoring Opportunities are trips inside the opponent’s 40-yard line, and Points Per Opportunity is the average number of points scored on those drives. Don’t worry too much about ETSU’s 5.67 PPO, they were gifted a Scoring Opportunity at the Tennessee 5 (although that could be cause for concern in itself).
Success Rate is the percentage of offensive plays that are “successful”. A play is marked successful if it
gains 50% of yards-to-go on 1st down
gains 70% of yards-to-go on 2nd down
gains a 1st down on 3rd/4th down
scores a touchdown
Tennessee’s 60% success rate on Saturday is exceptional—only 11 teams had a success rate higher than 60% this week FWIW, a Success Rate over 50% is really good. What I consider the height of Josh Heupel’s offense is the stretch of wins against LSU/Florida/Alabama in 2022, and the Vols’ offense maintained a +50% Success Rate in that run. That UT’s defense held ETSU’s offense to a 12% success rate is equally impressive.
Explosiveness is a measure of Predicted Points Added (PPA) on a successful play. This one gets a little more complicated—PPA is a stat that considers how all yards gained are not equal. PPA assigns point to yards based on down, distance, and field position.
Starting field position is the average distance from the opponent’s goal line. This was helped tremendously by Boo Carter’s tremendous returns against ETSU.
And my favorite stat: HAVOC, a percentage of plays where the defense recorded a tackle for loss, sack, forced a fumble, intercepted a pass, or broke up a pass. UT’s 46% Havoc rate on Saturday is, as you might guess, pretty pretty good.
Rushing Report
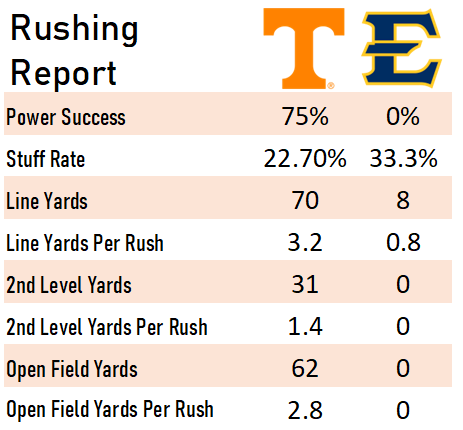
These stats have “garbage time” filtered out—meaning nothing after the game was statistically out of reach counts, which happened fairly early on Saturday. But before that point, the stats show that Tennessee’s run game and run defense were both dominant.
Power Success is the percentage of short-yardage runs that convert to a 1st down or touchdown.
Stuff rate is the percentage of run plays stopped at or behind the line of scrimmage.
Line Yards are 100% of the first 4 yards of a rush and 50% of yards 5-10 of a given rushing play (i.e., yardage that can reliably be attributed to the offensive line). Second-level Yards are yards 5-10 of a rush, and Open Field Yards are yards gained past 10 yards from the LOS. UT gave up zero 2nd-Level and Open Field Yards.
Usage Rate and PPA
Finally, a look at the usage rate (% of times a player carried, passed, caught, or was targeted with a pass) and the PPA gained by the player. First, ETSU, which I show not to beat a dead horse, but to emphasize the clamps Tennessee put on the Bucs:
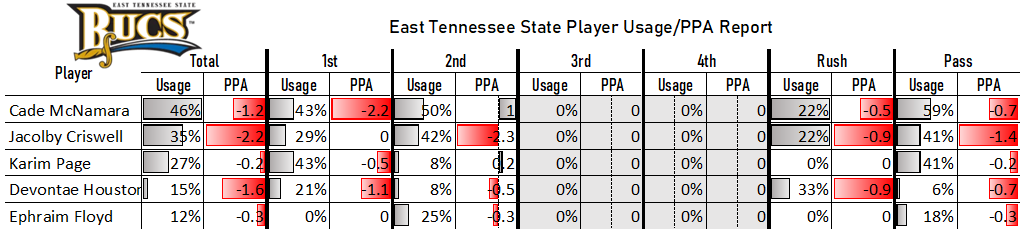
Tennessee had an incredible rate of holding the opposing QB to a negative PPA last year. On Saturday, they held both of ETSU’s QBs to a negative total PPA. And it’s true that PPA is not always a great individual stat, it’s also true that if the opposing QB is always in the negative, the defense is keeping that guy from beating them.
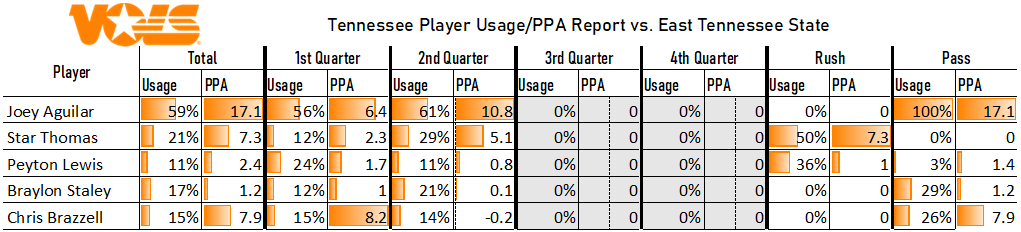
On the other end there’s Joey Aguilar with his +17.1 PPA. Also of note, Mike Matthews is not listed here because I took the top 5 players by usage rate. However, Matthews had +8.1 PPA on just 11% usage (Peyton Lewis’ usage in the chart is a typo—he was at 17% on Saturday). A big chink of Matthews’ PPA came on the improvised prayer from the Jaguilar, but I also have the feeling that Matthews needs to be targeted more in the coming weeks.