


Tennessee’s opening win against Furman went about as well as a game of that stature could go. You went in knowing that all your questions about this edition of Tennessee football weren’t going to be answered in this game, but the questions shifted from “can the Vols do X, Y, and Z?” to “can the Vols do X, Y, and Z against good teams?”
There will be plenty of chances to find that out, but the early returns are good. Faizon Brandon looked sharp in his debut, and his decisiveness and willingness to run when needed are qualities that have made the offense run at its best under Josh Heupel. Brandon became the first SEC QB to throw for three TDs and run for two more in his first start since Cam Newton for Auburn in 2010. And while I’m not saying Brandon will win a Heisman trophy and national championship, I’m not not saying it either.
Mike Matthews had a career-high 132 yards, DeSean Bishop ran for 97 and Justin Baker added a 73-yard TD in the 4th quarter. But beyond the offense, Jim Knowles and the new-look Tennessee defense also showed tremendous promise. The Vol defense cried havoc, totaling seven sacks and 13 tackles for loss, led by DT Xavier Gilliam’s six tackles, three sacks (the most in a game by a Vol since 2018, and the NCAA leader after week1), and five TFLs.
Five Factor Box Score
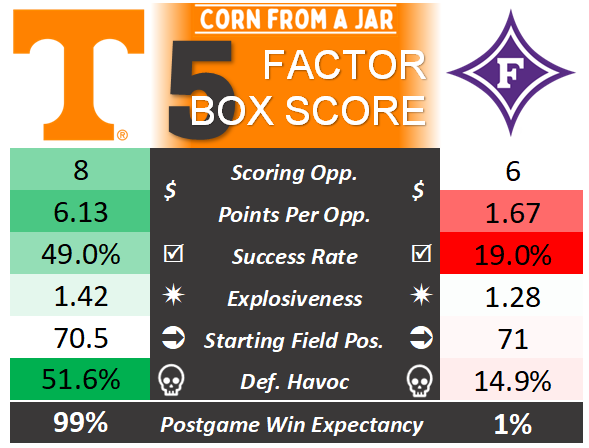
There are five factors most highly correlated with winning in college football: efficiency, explosiveness, field position, finishing drives, and turnovers. Those are represented above by:
Success Rate (efficiency): the percentage of time the offense stays “on schedule”, i.e., gaining 50% of needed yardage on 1st down, 70% of needed yardage on 2nd down, and/or converting a 3rd or 4th down.
Scoring Opportunities/Points Per Opportunity (finishing drives): an offensive trip inside the opposing 40 is considered a scoring opportunity. If you average close to 6 points on those drives, then you’re getting a TD almost every time you cross the 40. If you’re averaging closer to 3 points, you’re at least not having empty scoring opportunities, but you’re not keeping pace with the best offenses. If you’re averaging less than 3 points per opportunity, then you’re getting yourself into position to score and failing.
Explosiveness: there are many ways to measure explosiveness. I pull statistics from collegefootballdata.org and they use predicted points added per successful play. Basically, if the number is high, you’ve had a high percentage of big chunk plays, and if the number is low you have not (although the number could be low because you’re a grindy running team also). This stat tends to be a little misleading when it comes to UT, because the Vols often run a lot of plays, and they can’t all be bangers.
Starting Field Position: just like it says on the box. You want your number to be low (starting closer to the opponent goal line) and you want the opponent number to be high (starting further from your goal line).
Havoc (turnovers): my personal favorite stat, if for no other reason than it allows my to quote the line from Shakespeare’s Julius Caesar: “Cry HAVOC! And let slip the dogs of war”. Havoc plays include sacks, tackles for loss, interceptions, and pass breakups. While havoc plays don’t directly equate to turnovers, they do include turnovers and the types of plays most likely to lead to turnovers.
And if you don’t want to remember all of that, just keep in mind when looking at the chart that green-shaded numbers are good, red-shaded numbers are bad. Tennessee had a ton of green Saturday, including an incredible 52% havoc rate (meaning every other play was a havoc play). These numbers typically remove “garbage time” as well (when the game is statistically out of reach).
Rushing Report
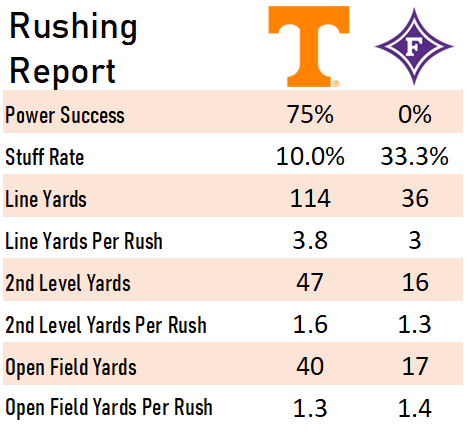
The rushing report is another fun little analytical tool that emphasizes how well the offensive line played.
Power success is the percentage of plays where you needed two yards and you got two yards.
Stuff rate is the percentage of your offensive plays that were stopped at or behind the line of scrimmage.
Line yards are the first four yards of a running play and 50% of yards 5-10. (Basically how good of a push you’re getting up front.) Second level yards are those yards between 5-10 yards past the LOS, and open field yards are yards gained 10+ yards beyond the LOS.
Usage/PPA

Finally we have Usage (the percentage of time a player was used as a passer, targeted receiver (receptions and targets are treated the same) or ball carrier. If you’re unsure about PPA, I made a video explaining it a while back, but simply put it is how much you’re helping your team get in a position to score. PPA is probably a better team stat than individual stat, but it does give an indication of a player’s level of contribution to a win or loss.

And when the opposing QB has a negative PPA, it was a great day for the defense.